95% of statisticians may be offended at this post.
Unfortunately, I’m going to be showing my ignorance about statistics here, I’m sure. I may even use Wikipedia to back up my arguments, which will offend many more of you.
Someone (ok, it was Wes Brown (@sqlserverio)) was talking about percentiles the other day, and someone else (I’m not going to volunteer who), was talking about this being a great use of the NTILE() function. Well, I disagree.
Don’t get me wrong, I love the ranking functions, and have been a long-time advocate of the OVER clause – the first presentation I ever did as an MVP (way back in 2006) was about this stuff. I just think that NTILE() isn’t really the right tool for this particular problem.
The 95th percentile is regarded as that point in your data where 95% of values are below it, and 5% are above it. Or perhaps a range, for which 2.5% are below the range and 2.5% are above the range. I don’t really want to get caught up about what’s correct here – that’s for you to decide, as you know your data better than me, and the style of percentile you want to go with. Proper statisticians can choose to argue or not.
The easy way to do it using statistical methods is to consider the range around the average, plus (or minus) twice the standard deviation. This is generally accepted as producing a “95 percent confidence interval”.
Also, it’s quite easy to do using T-SQL, as we have both AVG and STDEV functions. If I jump into the AdventureWorks database and look at the number of rows of my clustered indexes, I can run a query like this:
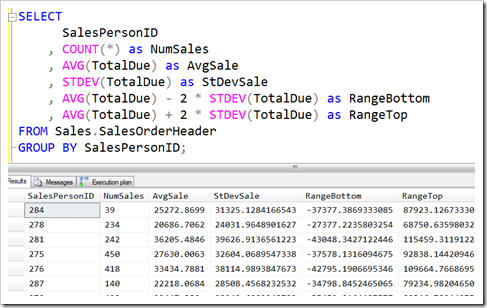
Interestingly, all my ranges start in the negatives, which doesn’t make good sense for a sales amount. Also, if I have a look to see how many outliers there are (ie, rows that fall outside the range), I see that it’s consistently more than the 2.5% that statisticians would have me believe should be higher than the top of the confidence interval (in fact, the lowest I get is 3.16%).
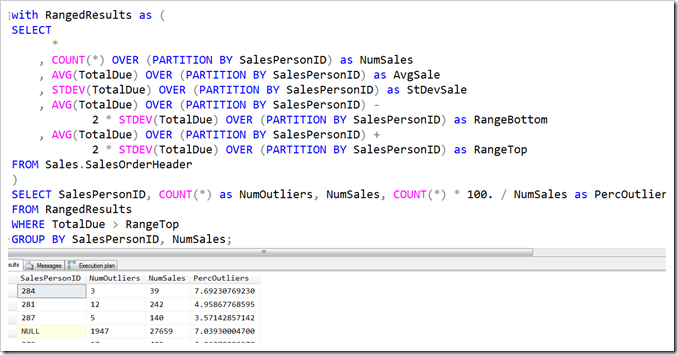
Now, this method might be just fine for your needs. There’s nothing statistically that says that you need to have 2.5% of your data higher than the particular mark. These are just numbers used to generalise over a set of data.
But if you need to find a mark over which fits 2.5% of your actual data, then you could take a different approach.
In steps NTILE()…
Consider that we divide our data into exactly 40 tiles, ordered by the value of interest. You’d expect that the highest tile would be outside the top of the range, and the lowest tile would be outside the bottom of the range. Brilliant! We’ve solved it.
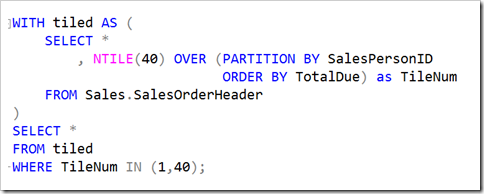
…except that we’d be tripped over by the detail, as is so often the case. It sounds really good, but doesn’t work in practice.
Suppose we only have 39 values… Oh no! We have no tile 40. I guess we’ll put NULL in for our percentile. Or maybe we should grab the value from the maximum TileNum instead – but is that actually correct? Really?
What if we have 41 values? Then TileNum #1 will have two values in it, and all the rest will only have 1. That’s hardly fair. If we have 79, then the last tile only has one while all the rest have two. There’s definitely something not right about this method. It sounds fine on the surface, but I’m just not happy with it once we look a bit deeper.
The tile concept isn’t necessarily awful though – I’m just going to tweak it a little, and abandon the idea of using NTILE().
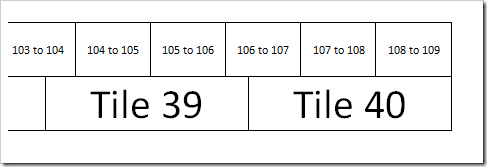
Imagine our tiles, where Tile 40 is our top 2.5% of values and Tile 1 is our bottom 2.5% of values. If we position our values evenly across them, we might get something like this (a bit of artistic license in play for the number of tiles and values of course)

Now let’s apply a bit of maths to the situation.
Suppose we have NumVals values (the red lines in the image above). This would mean that we have (NumVals – 1) gaps between those values. I’m spacing them evenly. (Otherwise, I’d be just looking at 97.5% of the difference between the min and the max)
Tile 40 starts 97.5% of the way along this range of values (because 39/40 = .975). In terms of those gaps between the red lines, it’s (NumVals – 1) * .975. And because I’m going to number my gaps starting at 1 (not zero), I’m going to add one to this. (NumVals – 1) * .975 + 1
SalesPersonID 290 has 109 values. Using this for NumVals, we find our point of interest as (109 – 1) * .975 + 1 = 106.3. My 97.5% mark is therefore going to sit .3 of the way between value 106 and 107, like in the diagram below.
In T-SQL, the FLOOR and CEILING functions help me find the two values of interest.
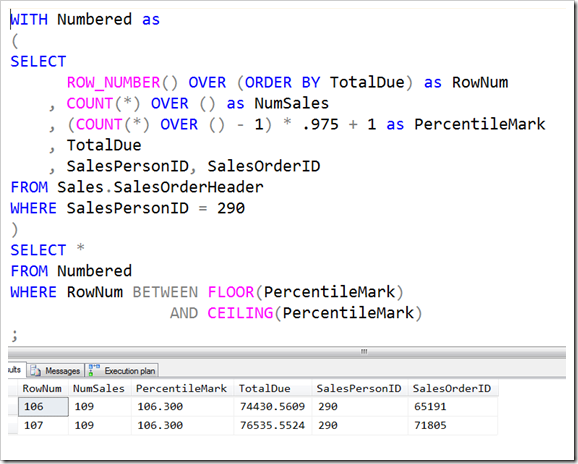
Now that I have these two rows, I can easily use MIN and MAX to handle the TotalDue values and find my 97.5% mark.
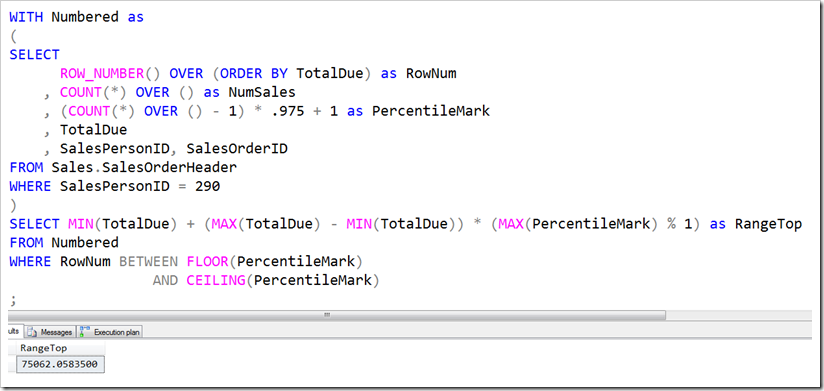
It’s okay to use MAX(PercentileMark) in that SELECT clause – it’s the same value for all the rows being extracted from the CTE, so it ought to be okay.
You’ll notice that the value of 75062 is indeed 30% of the way between 74430 and 76535. I can also be completely confident that exactly 3 items are more than this mark, which makes sense when we consider the idea behind 97.5%.
To make this work across a selection of values, I just need to use GROUP BY and PARTITION BY, so that the aggregates and row_numbers are applied to each salesperson separately.
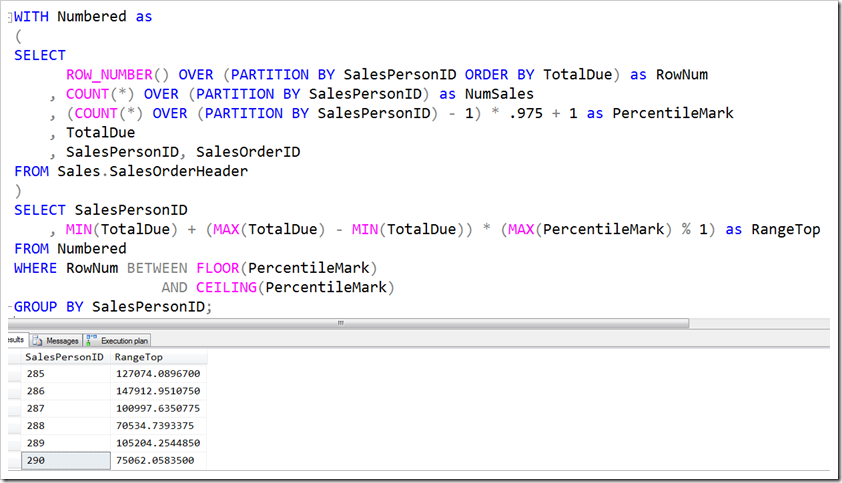
You can see that the value for salesperson 290 is produced correctly, and that we’ve found the top of the range for a 95% confidence interval. By using .025 as the value in the calculation for PercentileMark, we can easily work out the bottom of the range. Alternatively, if you need to find the .95 mark, then that will apply just as easily.
But like I said – many statisticians will be upset at my working here, so make sure that the ideas I’ve shown here fit with the way that your clients understand the idea of the 95th percentile.


This Post Has 15 Comments
Being lazy I just take the top 5 percent ordered desc, and take the top 1 off that ordered asc.
ie
select top 1 * from (select top 5 percent * from table ordered by val desc) ordered by val asc
Sure, it’s ugly, but it’s easy 🙂
Yeah, there are definitely a bunch of ways you can work out what you count as your 95th. This method was as much an exercise in picturing a solution as anything, and trying to be sure of how things work when you don’t have a nice round number.
Hi Rob
Very interesting post and a great technique, thanks for sharing it.
The difference between your approach and any technique using stddev is essentially whether you want the top % of a sample or of the entire population. Stddev takes the limited sample data available and projects the distribution characteristics of the much larger unknown population.
Both techniques are equally valid, and as you pointed out, depend on what definition of percentile is required. I.e. Do you have all available data or just a sample of it.
Given this, hopefully you should avoid a bashing from the stats folk!
Ah, true. And hopefully statisticians won’t mind my method either. Thanks Alex.
What I did at one point in time in algorithm/psuedo-code form
-get the total number of the set
-get the ideal index (0.95 * N)
-get the entry right below that index and right above
-take the value of the one below
-take the difference of the one below and above
-add the fractional difference based on the index between the two numbers to the lower value
I hope that makes sense. If I want greater speed I just round and use the top function or row_number functions.
Yes, that’s the algorithm I applied here. But you have to make sure you subtract one and add it back again afterwards, because if you have just two numbers, you have one range between those two. Your point should be 1.95 not 1.9.
Rob
"95% of statisticians may be offended at this post"
Hilarious! Thank you!
/Lars H
This is very useful.
Many thanks.
Hello guys, that looks really interesting
my question is , if i want to use the final percentile function which part of code should i use?
thanks in advanced
Then change the .975 to .99
Mr. Rod are u answering to me?
Yes, Perastikos, I am.
Sorry i gou confused,
i have table with these values
2.56280
0.10534
and i want to take percentile of 90 of these values, which picture of your code should i execute?
i want to manage same think like excel, that uses this formula :
PERCENTILE(A2:A4;J2)
Use the second-last one, and change the 0.975 value to whatever you want.
Hello again, i run the code from second last picture, i have those two values in my table,
5.04799 and 6.11519
i want to take 90% and 10% percentile of these values, when i run the code twice for 90% and 10% i take exactly the same values in rangetop :
5.17092
in excel i take for 90% : 6% and 10% : 5%
any help?